Feedier 3.0.0: Reports more powerful than ever

Over the last few months, our team has invested significant resources in improving one of the key modules of our platform: Reports.
We are pleased to announce the latest version of the Reports module. This new report has been thoughtfully designed to help you make better decisions with more speed and accuracy.
Here are the key improvements made in version 3.0.0 compared with the previous version.
Report 3.0.0 improvements compared
Please note that PDF reports (old) will continue to work after the next release.
| Previous reports | New reports |
|---|---|
|
|
Improved reports page
Creating a report
To create a new report, you now have the choice between creating an old report or a new one. For any new report you create, you can change the name and type of report. You can choose between three options:
-
Public report : Accessible to anyone with the link.
-
Private report : Only you have access to this report.
-
Master report : Only members of your organization can view the report.
New reports details
We’re very excited to bring you this brand new version of the reports. It’s also very important to remind you that, in terms of performance, these reports are 1000 times faster than the previous ones.
Once again, this is proof of our investment in providing you with the best possible experience when you log on to the platform.
Report layout details
A new layout makes the report easier to manage and navigate. Pages are now listed on the left for easier navigation, while the “Report”, “Insert” and “Page” buttons provide quick and easy access to component management and creation options. What’s more, it is now possible to edit an existing component by clicking on it, not only on the icon, but also on the entire graphic.
Component visualization
We’ve introduced a new feature allowing you to include multiple components on a single page, but this option is only available for benchmarking, KPIs, scores and the correlation matrix. You can also personalize component display by dragging the report from side to side or adjusting its size using the icons provided.
Different workflows
New way of creating components: as well as clicking on the component in the side panel, you can now drag and drop it.
It’s also important to note that components now have a default configuration when they are created, saving you time when creating reports.
It is crucial to emphasize that each modification requires a click on the “SAVE” button to ensure correct application of the changes.
Filter results by component
The Feedier report now lets you manage filters more efficiently. You can now add filters by component, instead of relying solely on a global filter for the entire report.
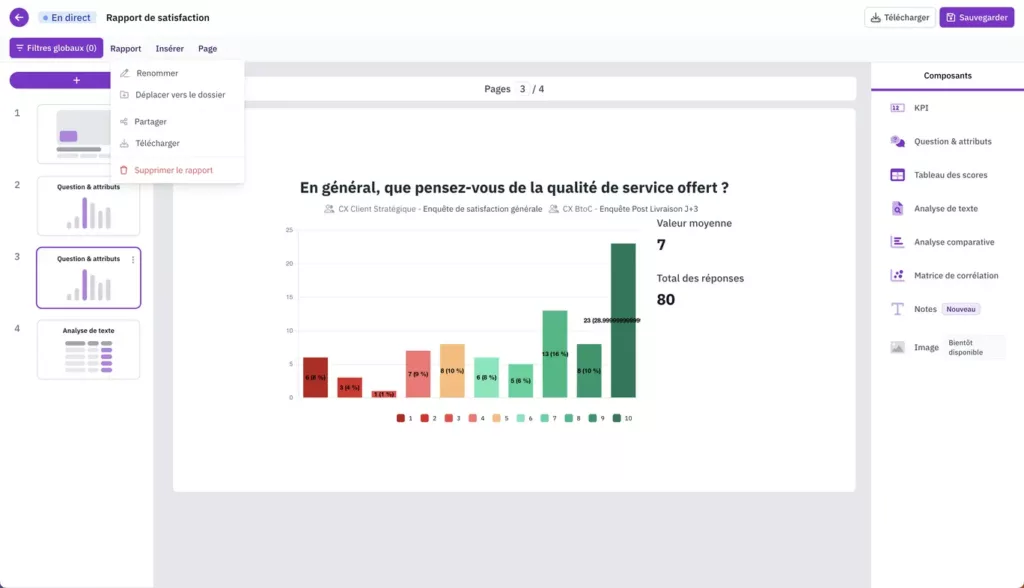
New component specifications
Let’s turn now to the improvements we’ve made to the user interface and components.
Questions and attributes
We’re delighted to inform you that the Customer Effort Score (CES) has now been integrated into the “questions and attributes” component.
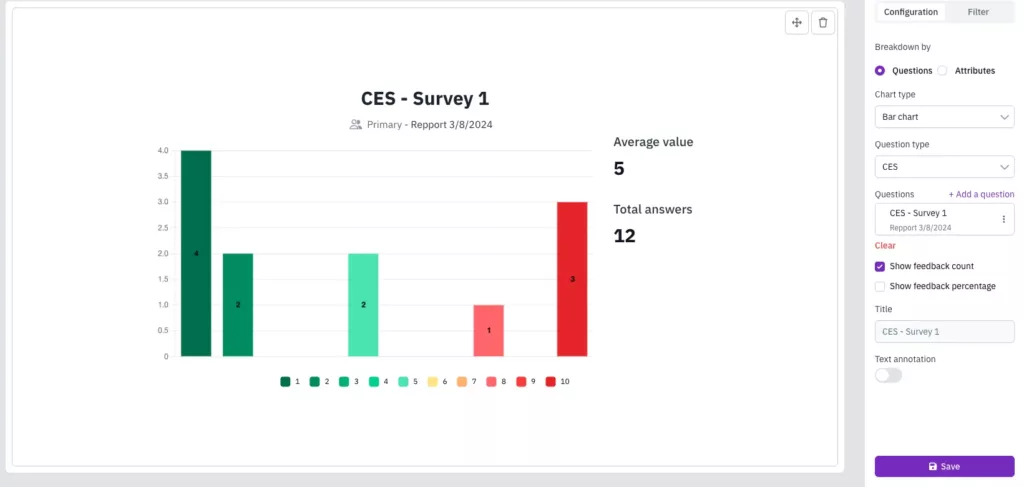
Creating a question/answer graph
Creating an attribute graph
Creating KPI charts
Creating score tables
Add a text analysis report
Creating a correlation matrix
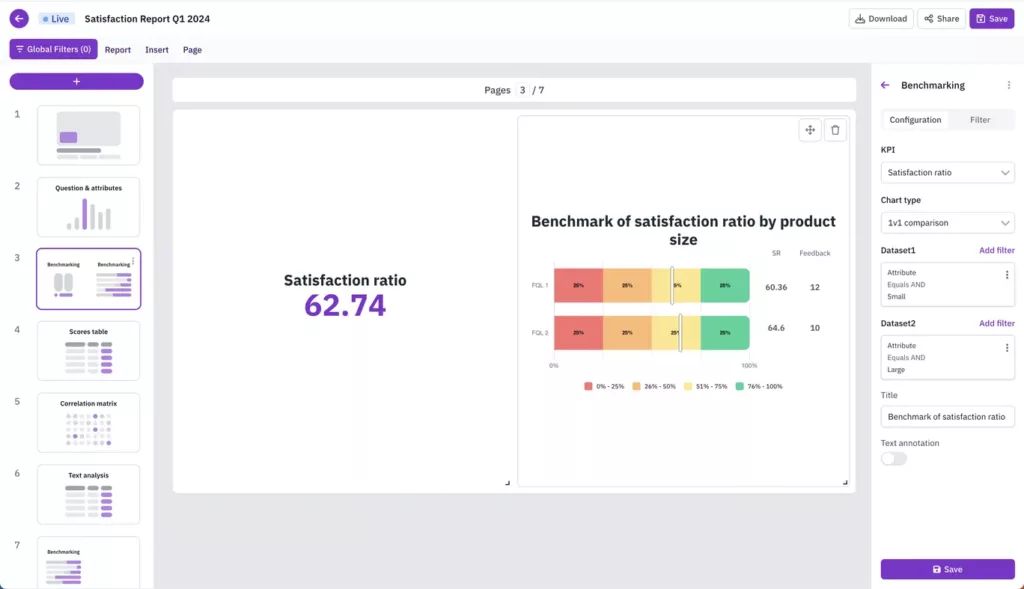
Benchmarking
Author
Florian Marette
Share
Did you enjoy our resource?